
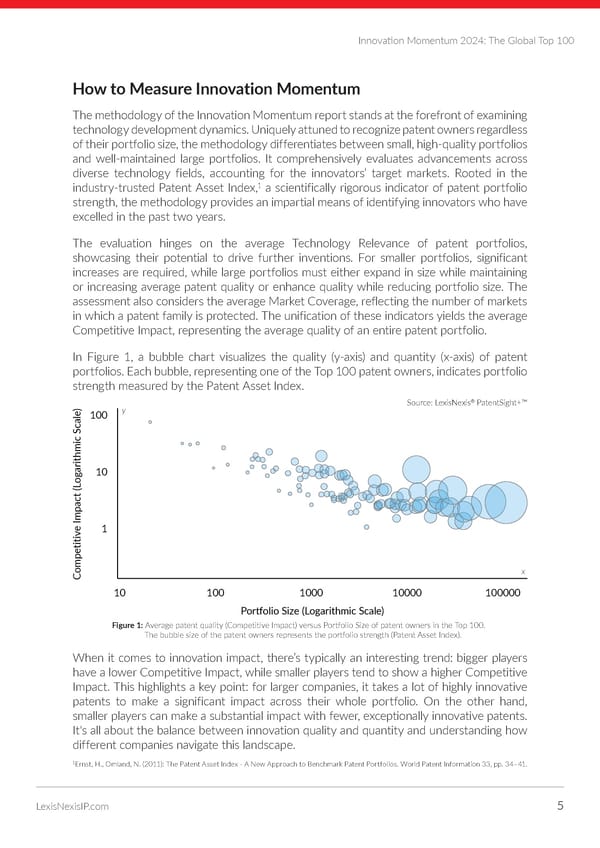
Innova琀椀on Momentum 2024: The Global Top 100 How to Measure Innovation Momentum The methodology of the Innovation Momentum report stands at the forefront of examining technology development dynamics. Uniquely attuned to recognize patent owners regardless of their portfolio size, the methodology differentiates between small, high-quality portfolios and well-maintained large portfolios. It comprehensively evaluates advancements across diverse technology fields, accounting for the innovators’ target markets. Rooted in the 1 industry-trusted Patent Asset Index, a scientifically rigorous indicator of patent portfolio strength, the methodology provides an impartial means of identifying innovators who have excelled in the past two years. The evaluation hinges on the average Technology Relevance of patent portfolios, showcasing their potential to drive further inventions. For smaller portfolios, significant increases are required, while large portfolios must either expand in size while maintaining or increasing average patent quality or enhance quality while reducing portfolio size. The assessment also considers the average Market Coverage, reflecting the number of markets in which a patent family is protected. The unification of these indicators yields the average Competitive Impact, representing the average quality of an entire patent portfolio. In Figure 1, a bubble chart visualizes the quality (y-axis) and quantity (x-axis) of patent portfolios. Each bubble, representing one of the Top 100 patent owners, indicates portfolio strength measured by the Patent Asset Index. ) Source: LexisNexis® PatentSight+™ ale100 y c garithmic S10 o mpact (L e I 1 titiv ompe x C 10 100 1000 10000 100000 Portfolio Size (Logarithmic Scale) Figure 1: Average patent quality (Competitive Impact) versus Portfolio Size of patent owners in the Top 100. The bubble size of the patent owners represents the portfolio strength (Patent Asset Index). When it comes to innovation impact, there’s typically an interesting trend: bigger players have a lower Competitive Impact, while smaller players tend to show a higher Competitive Impact. This highlights a key point: for larger companies, it takes a lot of highly innovative patents to make a significant impact across their whole portfolio. On the other hand, smaller players can make a substantial impact with fewer, exceptionally innovative patents. It's all about the balance between innovation quality and quantity and understanding how different companies navigate this landscape. 1 Ernst, H., Omland, N. (2011): The Patent Asset Index - A New Approach to Benchmark Patent Portfolios. World Patent Information 33, pp. 34–41. LexisNexisIP.com 5
 LexisNexis Innovation Momentum Embed 2024 Page 4 Page 6